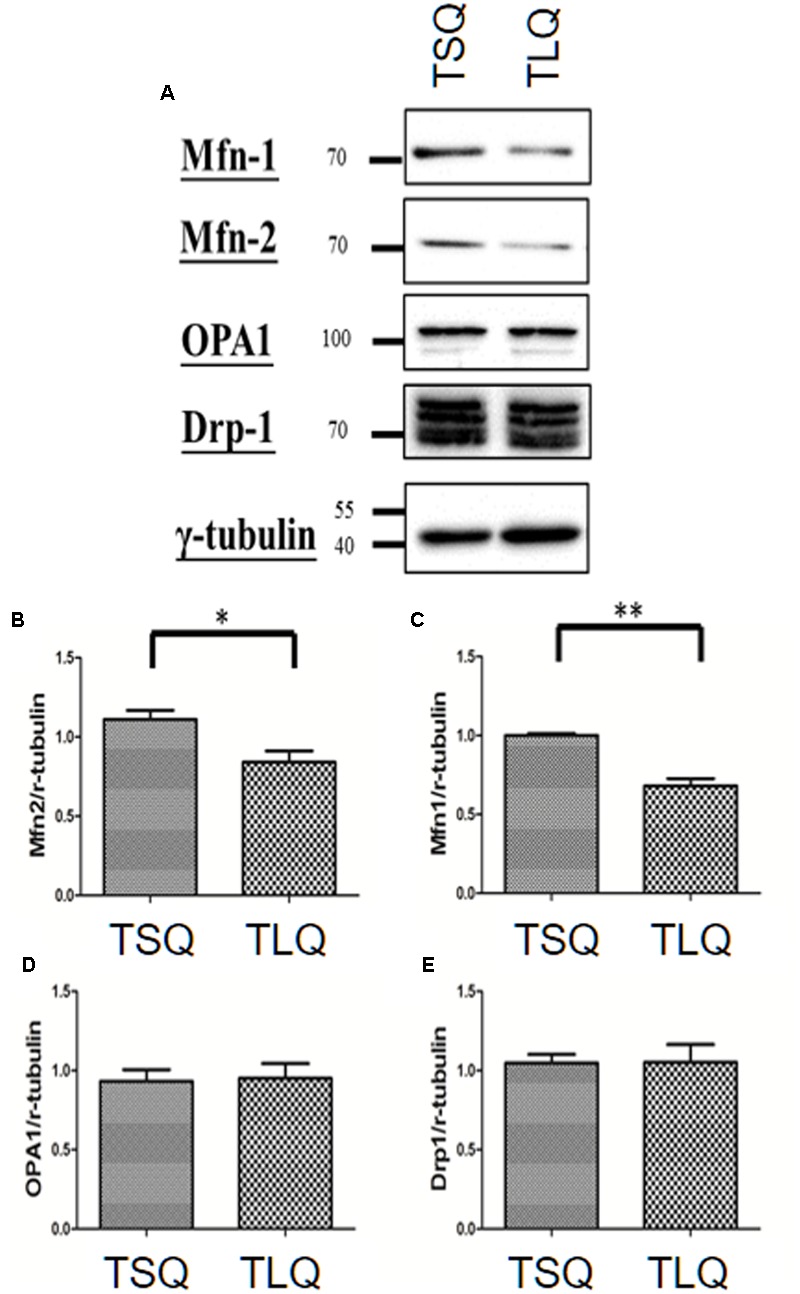
FIGURE 4.

Expression of mitochondrial proteins in TSQ and TLQ N2a cells. N2a cells were transfected with TSQ and TLQ for 48 h, and then subjected to Western blotting using Mfn-1, Mfn-2, OPA1, and Drp-1 antibodies (A). Quantitative results of Mfn-1 (B), Mfn-2 (C), OPA1 (D) and Drp-1 (E) were normalized by an internal control, γ-tubulin. ∗ represents p < 0.05 and ∗∗ represents p < 0.01. Data represent the mean ± SD. N = 3 batches of experiments.
