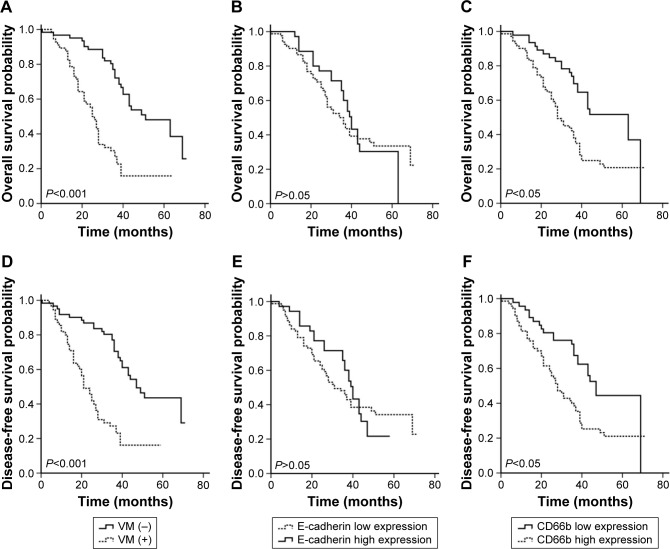
Figure 3.
Kaplan–Meier curves for clinical reference values. It is significantly different between positive-VM group and negative-VM group (A: OS, log-rank test, χ2=28,762, P<0.001; D: DFS, log-rank test, χ2=25.320, P<0.001), and statistically significant differences were found between CD66b low-expression group and CD66b high-expression group (C: OS, log-rank test, χ2=10.962, P=0.001; F: DFS, log-rank test, χ2=9.225, P=0.002). But there is no statistically significant difference between E-cadherin low-expression group and high-expression group (B: OS, log-rank test, χ2=0.051, P=0.821; E: DFS, log-rank test, χ2=0.064, P=0.800).
Abbreviations: VM, vasculogenic mimicry, OS, overall survival; DFS, disease-free survival.

