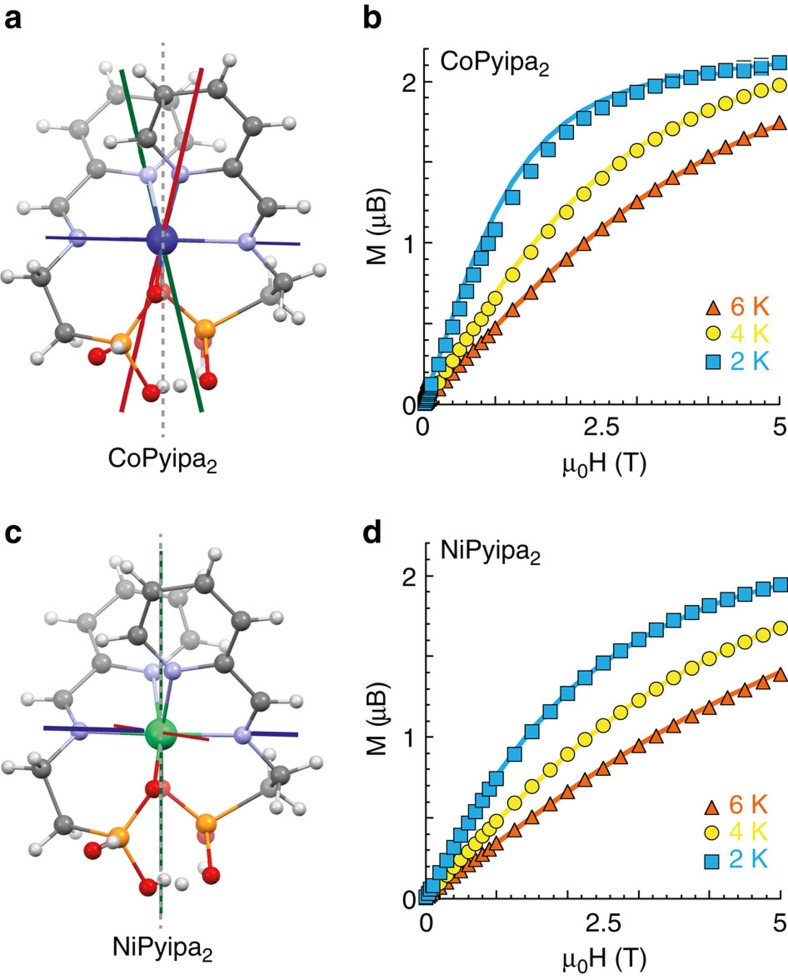
Figure 2. Complex Co- and Ni(Pyipa)2.
X-ray crystal structure of Co(Pyipa)2 (a) and Ni(Pyipa)2 (c); C, grey; N, lilac; O, red; P, orange; H, white; Co, blue; Ni, green. The red, green and blue axes represent the x, y, z direction of the anisotropy tensor, respectively. The magnetization as a function of field plots for Co(Pyipa)2 (b) and Ni(Pyipa)2 (d) solid lines correspond to the best fits; see SI for the parameter values.

