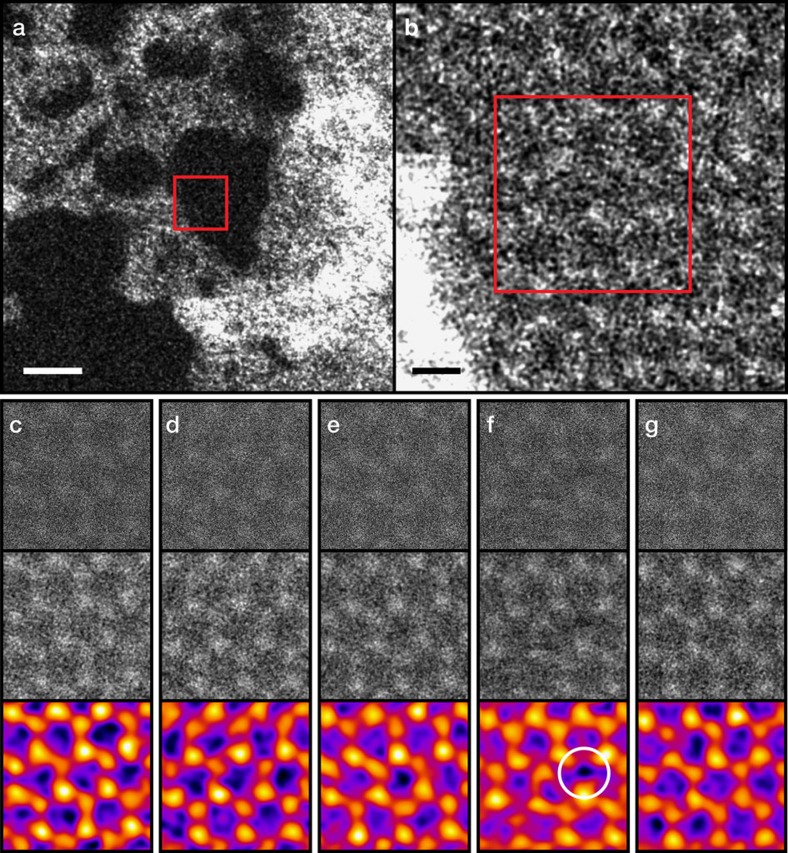
Figure 1. Example of the STEM displacement measurements.
The micrographs are medium angle annular dark field detector images recorded at 95 kV. (a) A spot on the graphene membrane, containing clean monolayer graphene areas (dark) and overlying contamination (bright). Scale bar, 2 nm. (b) A closer view of the area marked by the red rectangle in (a), with the irradiated area of the following panels similarly denoted. Scale bar, 2 Å. (c–g) Five consecutive STEM frames (∼1 × 1 nm2, 512 × 512 pixels (px), 2.2 s per frame) recorded at a clean monolayer area of graphene. A single carbon atom has been ejected in the fourth frame (f, white circle), but the vacancy is filled already in the next frame (g). The top row of (c–g) contains the unprocessed images, the middle row has been treated by a Gaussian blur with a radius of 2 px, and the coloured bottom row has been filtered with a double Gaussian procedure3 (σ1=5 px, σ2=2 px, weight=0.16).

