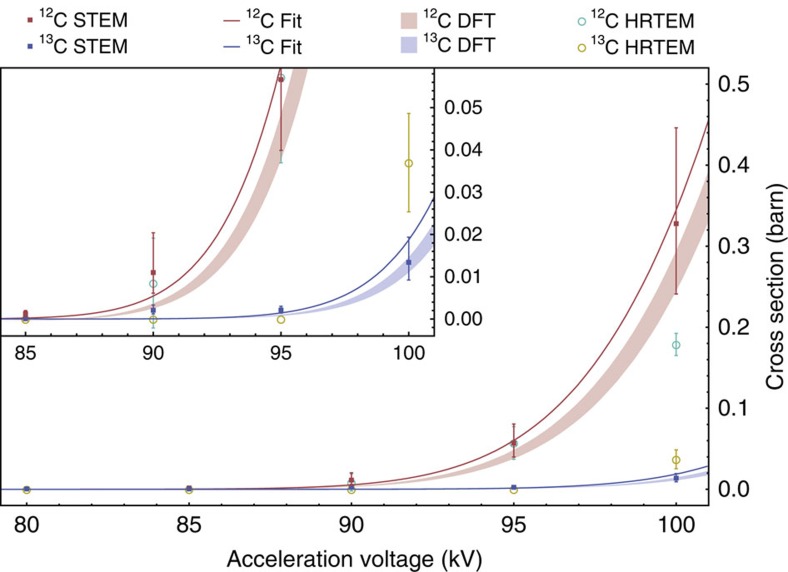
Figure 2. Displacement cross sections of 12C and 13C measured at different acceleration voltages.
The STEM data is marked with squares, and earlier HRTEM data11 with circles. The error bars correspond to the 95% confidence intervals of the Poisson means (STEM data) or to previously reported estimates of statistical variation (HRTEM data11). The solid curves are derived from our theoretical model with an error-weighted least-squares best-fit displacement threshold energy of 21.14 eV. The shaded areas correspond to the same model using the lowest DFT threshold Td∈[21.25, 21.375] eV. The inset is a closer view of the low cross section region.

