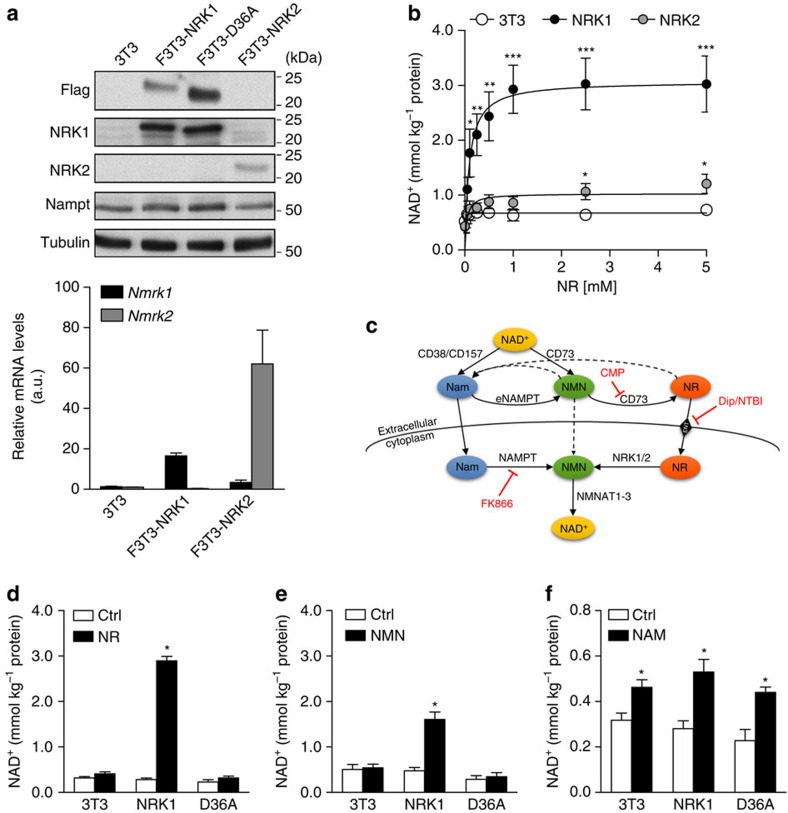
Figure 2. Slight overexpression of NRKs potentiates NR- and NMN-driven NAD+ synthesis.
(a) NRK1 and NRK2 protein expression and mRNA levels in NIH/3T3 and stable cell lines with one additional copy of either of NRK (F3T3 cells). (b) NAD+ measurement in NR dose-response treatment of F3T3 cells. (c) Schematic of NAD+ precursors metabolism (d–f) NAD+ measurement in F3T3 cells treated for 6 h with 0.5 mM NR (d), 0.5 mM NMN (e) and 5.0 mM NAM (f). Results shown are mean±s.e.m., *P<0.05, **P<0.01, ***P<0.001 versus ctrl by two-sided unpaired T-test (n=3).

