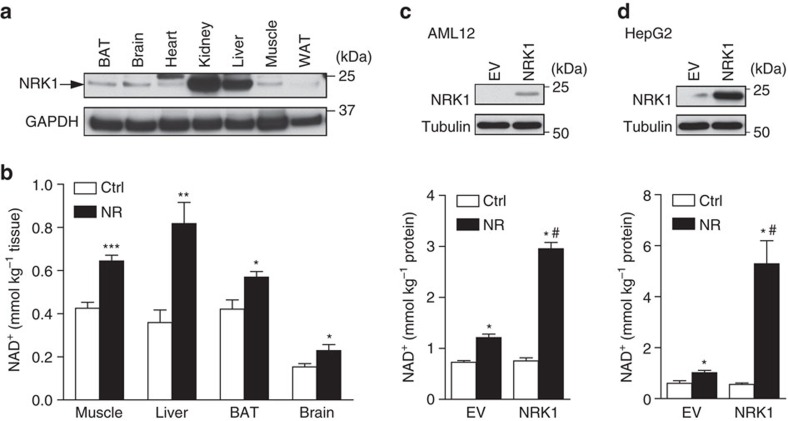
Figure 3. NRK1 and NR metabolism in hepatic cells.
(a) Protein levels of NRK1 in mouse tissues. (b) 7–9 weeks old WT male mice were IP injected with 500 mg kg−1 of NR or vehicle and tissues were collected after 1 h. NAD+ measurement in selected tissues, n=5 per group. (c,d) AML12 (c) and HepG2 (d) cells were transfected with NRK1-overexpressing vector. NRK1 protein levels and NAD+ measurement after 6 h 0.5 mM NR treatment. Results shown are mean±s.e.m., *P<0.05, **P<0.01, ***P<0.001 versus ctrl; #P<0.05 versus EV by two-sided unpaired T-test or (in c and d) one-way ANOVA followed by Bonferroni's post-hoc test (n=3).

