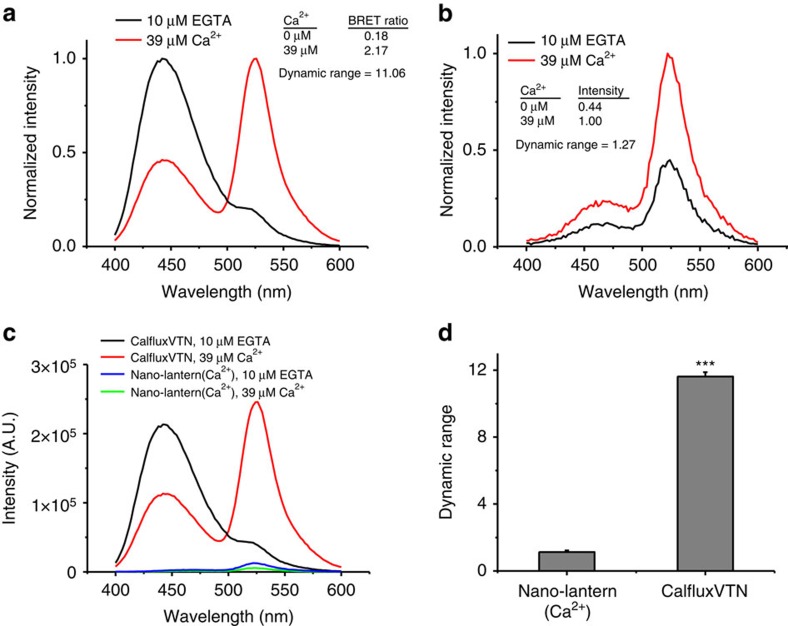
Figure 2. Comparison of the intensity and ratio changes of CalfluxVTN and Nano-lantern(Ca2+).
(a) The normalized emission spectra of equal amounts of purified CalfluxVTN and (b) Nano-lantern(Ca2+) proteins. Each protein’s effective concentration was estimated by the intensity of its fluorescence signal under the same conditions. Spectra were recorded in 10 μM EGTA or 39 μM Ca++ solutions using a QuantaMaster spectrometer. (c) Plots of unnormalized spectra of CalfluxVTN and Nano-lantern(Ca2+) to compare relative intensities of each probe. (d) The values obtained in 10 μM EGTA or 39 μM Ca++ solutions were recorded and the maximum dynamic ranges were calculated. Dynamic range was calculated as [R−R0]/R0 (for CalfluxVTN) or as [I−I0]/I0 (for Nano-lantern(Ca2+)), where R, ratio and I, intensity. (Mean±s.d., n=3., ***P<0.001, unpaired t-test). a.u., arbitrary unit.

