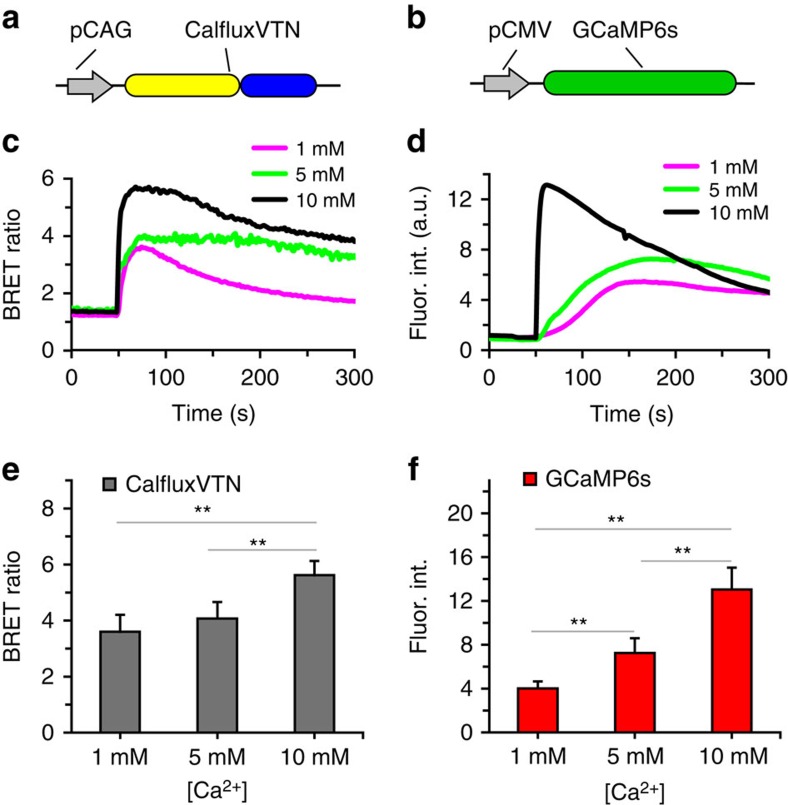
Figure 4. Comparison of the Ca++- induced responses between CalfluxVTN and GCaMP6s.
(a) CalfluxVTN driven by pCAG and (b) GCaMP6s driven by pCMV in HEK293 cells. (c,d) In all, 10 μM ionomycin was added (at ∼50 s) to HEK293 cells in 1 mM, 5 mM or 10 mM CaCl2-containing medium expressing CalfluxVTN (c) or GCaMP6s (d). Plots depict the average responses. (e,f) Graphs showing the average peaks of the [Ca++]-dependent responses of CalfluxVTN (e) and GCaMP6s (f) to ionomycin induced Ca++—influx. (for each sample group, data come from four separate experiments with a total cell number between 17 and 24; mean±s.e.m., **P<0.01, paired t-test). The calibration curve generated for microscope analysis (Supplementary Fig. 8) is relevant to these data. a.u., arbitrary unit.

