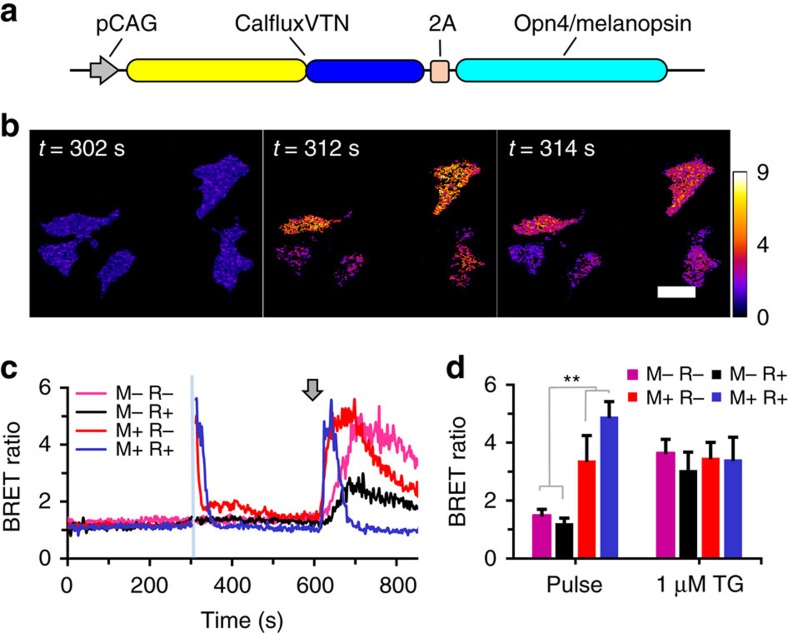
Figure 5. Coupling BRET Ca++ sensing with an optogenetics probe that regulates store-operated Ca++ (SOC) release.
(a) Bicistronic pCAG-driven construct encoding CalfluxVTN and mouse melanopsin (opn4). (b) Photomicrographs of the ratiometric image of BRET emitted from HEK293 cells expressing CalfluxVTN and melanopsin (retinal-treated, M+/R+) in c over the time course just before (302 s) and for 2 s (times 312–314 s) after stimulation with a 10 s blue light pulse between 302–312 s (scale bar, 20 μm). (c) Optogenetically stimulated ratiometric changes in BRET after excitation of melanopsin with 10 s blue light (at blue line, time 302 s; pulse is 470 nm±30 nm) in HEK293 cells expressing either the construct in a or CalfluxVTN alone (M=transfected with opn4, R=treated with all-trans-retinal). HEK293 cells that do not express melanopsin (=M−, construct shown in Figs 3a and 4a) do not exhibit a BRET ratio change in response to the blue light pulse. Both groups of cells (M+ and M−) show large and persisting changes in BRET ratio in response to stimulation of SOC release by 1 μM thapsigargin (at arrow). Some of the preparations were additionally treated with 100 nM all-trans-retinal (R+) to reconstitute a larger amount of active melanopsin4. See also Supplementary Movie 2. (d) Quantification of the HEK293 cells’ responses in c of the peak BRET ratio after light stimulus (Pulse); peak ratio after thapsigargin was added (1 μM TG). (For each sample group, data come from three separate experiments with a total cell number between 14 and 16; mean±s.e.m., **P<0.01, F=20.7, M+ compared with M−, 2-factor analysis of variance (ANOVA)) The calibration curve generated for microscope analysis (Supplementary Fig. 8) is relevant to these data. TG, 1 μM thapsigargin.

