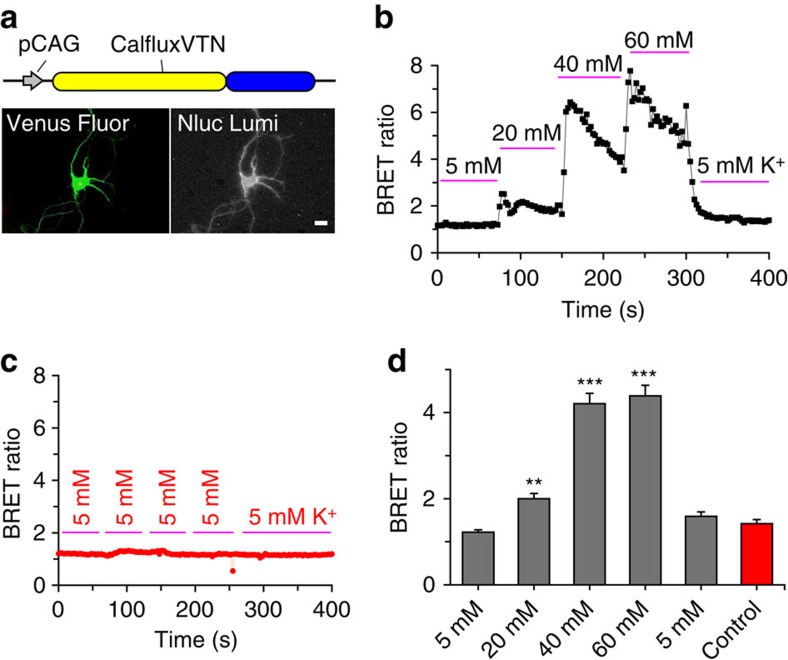
Figure 7. CalfluxVTN reports depolarization-evoked Ca++ fluxes in rat hippocampal neurons.
(a) CalfluxVTN construct driven by CAG promoter (pCAG37) for mammalian cell expression (upper panel), and photomicrograph of a single hippocampal neuron expressing the construct. Fluorescence of the Venus moiety (lower left panel) and luminescence of NanoLuc (lower right panel) are shown (scale bar, 10 μm). (b) BRET ratio increased (indicating increase of intracellular [Ca++]) in hippocampal neurons as the medium was exchanged with increasing concentrations of K+ (from 5 to 60 mM KCl; n=6 independent cells). (c) When medium was exchanged repeatedly with control medium (5 mM KCl; n=3 independent cells), there was no change in BRET ratio, indicating that the changes observed in b were not due to physical manipulations. (d) Quantification of the neurons' responses to varying [K+] illustrated in b and c (mean±s.e.m. **P<0.01, ***P<0.001, 1-factor analysis of variance (ANOVA)). The calibration curve generated for microscope analysis (Supplementary Fig. 8) is relevant to these data.

