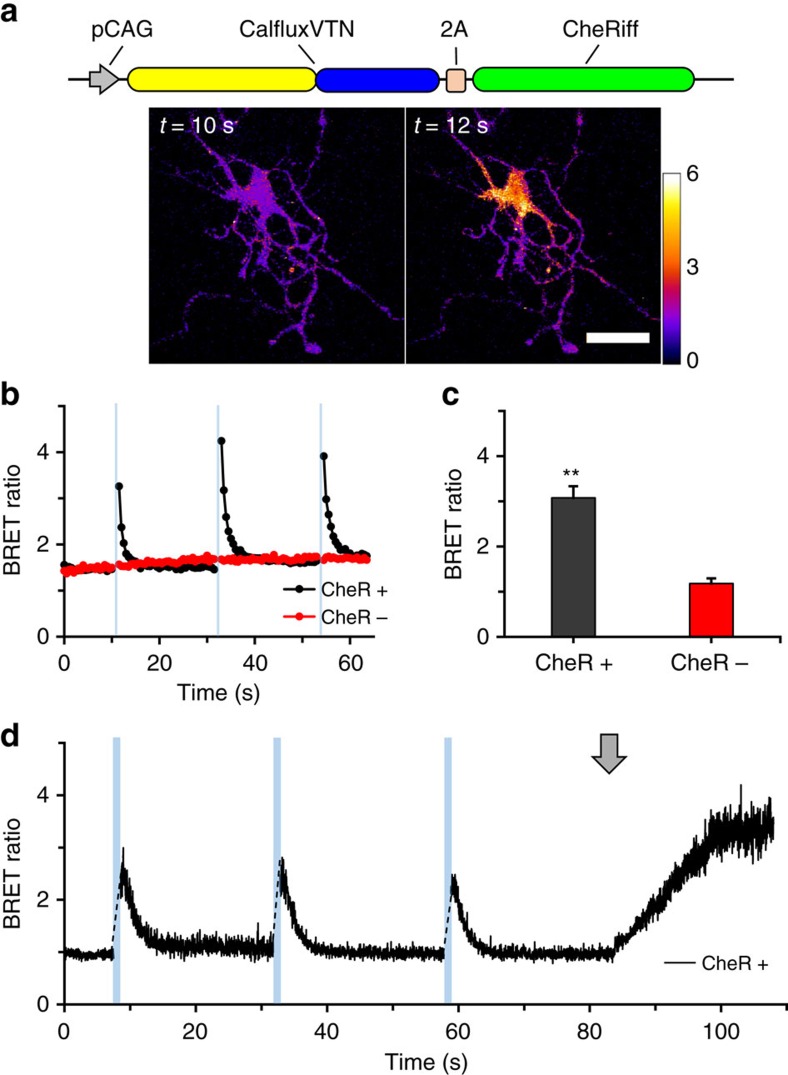
Figure 9. CalfluxVTN detects Ca++ fluxes elicited by optogenetically stimulated depolarization.
(a) CheRiff is a ChR2 variant that evokes a peak photocurrent when excited by blue (460 nm) light10. CheRiff was co-expressed with CalfluxVTN in rat hippocampal neurons and emission wavelengths detected by light microscopy. Micrographs show BRET ratiometric images before (10 s) and after (12 s) blue light stimulation (scale bar, 20 μm). BRET ratio pseudocolour scale is shown next to the right micrograph. (b) One second blue light (470 nm±30 nm) pulses to cells expressing CalfluxVTN with (CheR+) and without (CheR-) CheRiff; both populations of cells were treated with 10 μM furimazine24 (imaged at 1 Hz recording rate). See also Supplementary Movie 4. (c) Quantification of the changes in BRET ratios seen in b after stimulation with blue light (with CheRiff, n=11 independent cells; without CheRiff, n=8 independent cells, mean±s.e.m. **P<0.01, F=34.6,1-factor analysis of variance (ANOVA)). (d) Responses of another hippocampal neuron transfected with CheRiff imaged at a higher recording speed (40 Hz). Blue bars indicate the time of 1-second blue light pulses, while the grey arrow indicates the addition of 80 mM high K+ medium. The calibration curve generated for microscope analysis (Supplementary Fig. 8) is relevant to these data. The neurons in a−c were transfected with DNA-Ca3(PO4)2 precipitation32,33,38, whereas the neurons in the experiment of d were transduced with the AAV-CalfluxVTN vector.

