Figure 3.

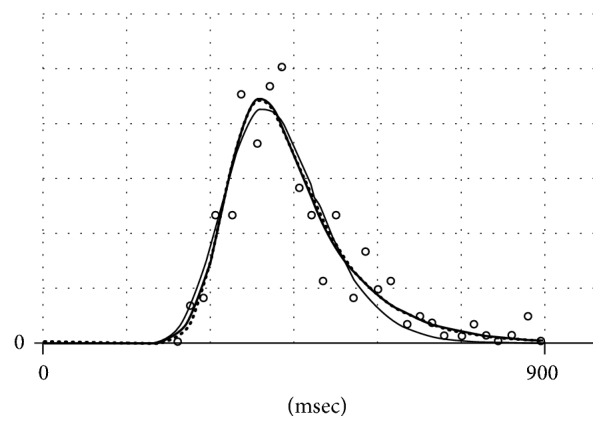
Data on response time distribution (RTD) picked up from [20] (open circles), which are approximated with EMG (thick solid line), EMGD (dots), and Wald distribution (thin solid line). The vertical scale is irrelevant.

Data on response time distribution (RTD) picked up from [20] (open circles), which are approximated with EMG (thick solid line), EMGD (dots), and Wald distribution (thin solid line). The vertical scale is irrelevant.