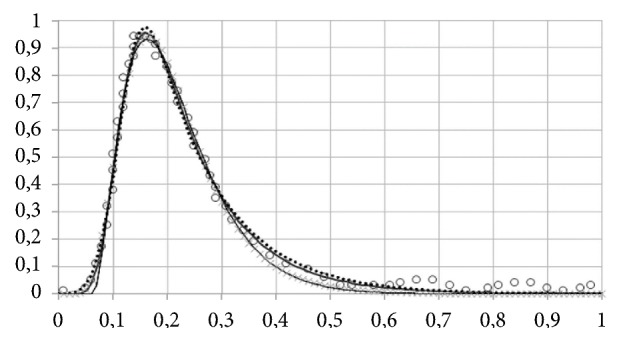
Figure 5.

Fitting data on an amperometric spike produced by adrenaline release from adrenal medulla cell synaptic vesicle. Data points (open circles) are obtained by manual tracking of an amperometric trace presented in [36]. Scales are arbitrary. EMGD: thick solid line; EMG: dotted line; shifted gamma-distribution: thin solid line; lognormal distribution: symbols ×. Fits by determination coefficient (r2): EMGD (0.993) > EMG (0.991) > lognormal = shifted gamma (0.990).
