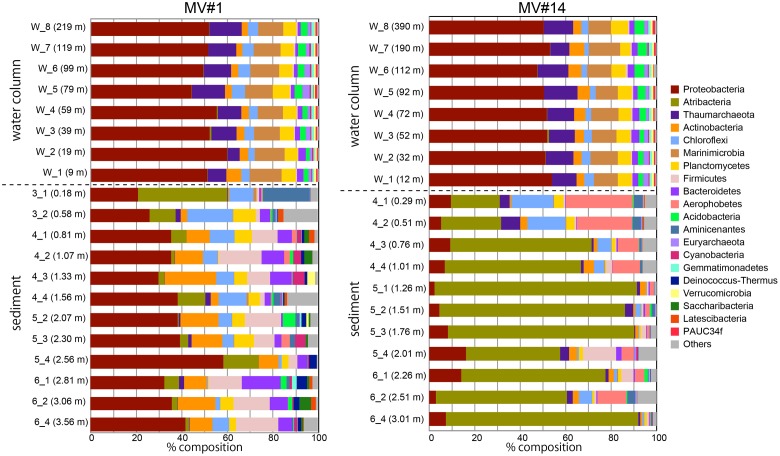
FIGURE 4.
Microbial community composition in the sediment and overlying seawater at two SMVs using phylum-level classification. Only the top 20 phyla are shown. Numbers in parentheses show the water column depth (meters above the SMV summit) for water samples (labels that start with “w”) and depth in sediment for sediment samples (labels that start with numbers).

