
Figure 1.
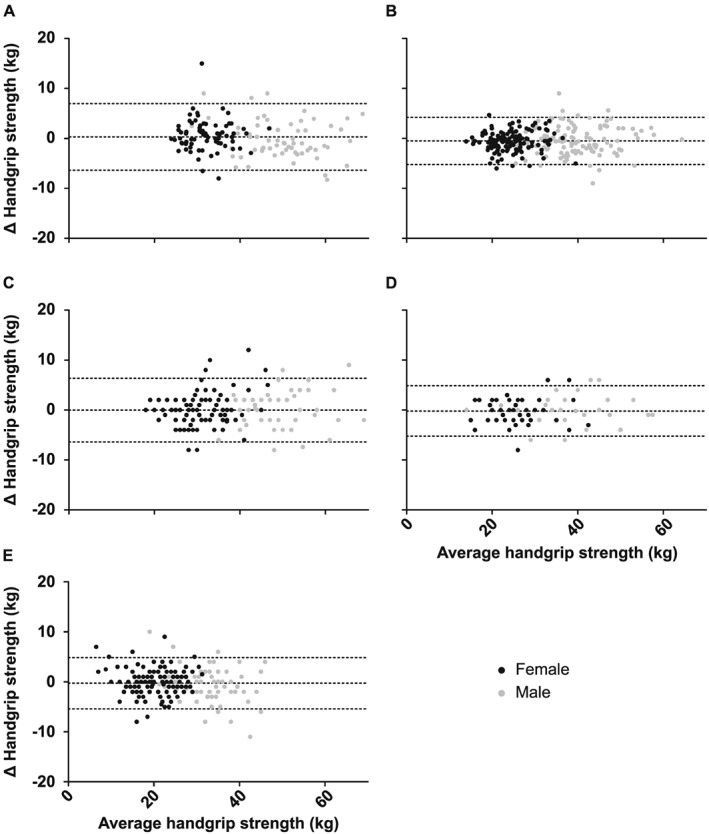
Bland–Altman plots of handgrip strength at attempt 1 vs. attempt 2. Results are stratified by cohort and age: MyoAge cohort ((A) healthy young, (B) healthy old), Grey Power cohort ((C) middle‐aged, (D) old) and geriatric outpatients (E). The dashed lines represent the mean difference in handgrip strength with the upper and lower 95% limits of agreement (mean difference ± 1.96 SD). Grey dots represent males and black dots represent females. Δ = difference.