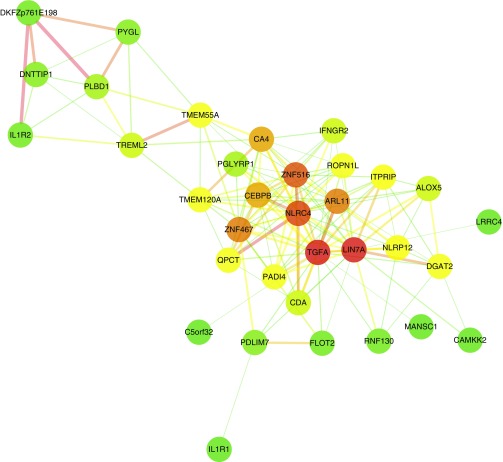
Figure 2.
Visualization of the most highly connected nodes in the blue module. For improved clarity, only those nodes with the highest module memberships are considered (up to a maximum of 40), and only those connections with a topological overlap greater than 0.025 are shown. Cytoscape 3.2.158 was used to visualize the network with a prefuse force-directed layout. Genes are represented by nodes of different colors, with colors corresponding to degree (green to red indicating low to high). Edge thickness is proportional to the strength of the association.

