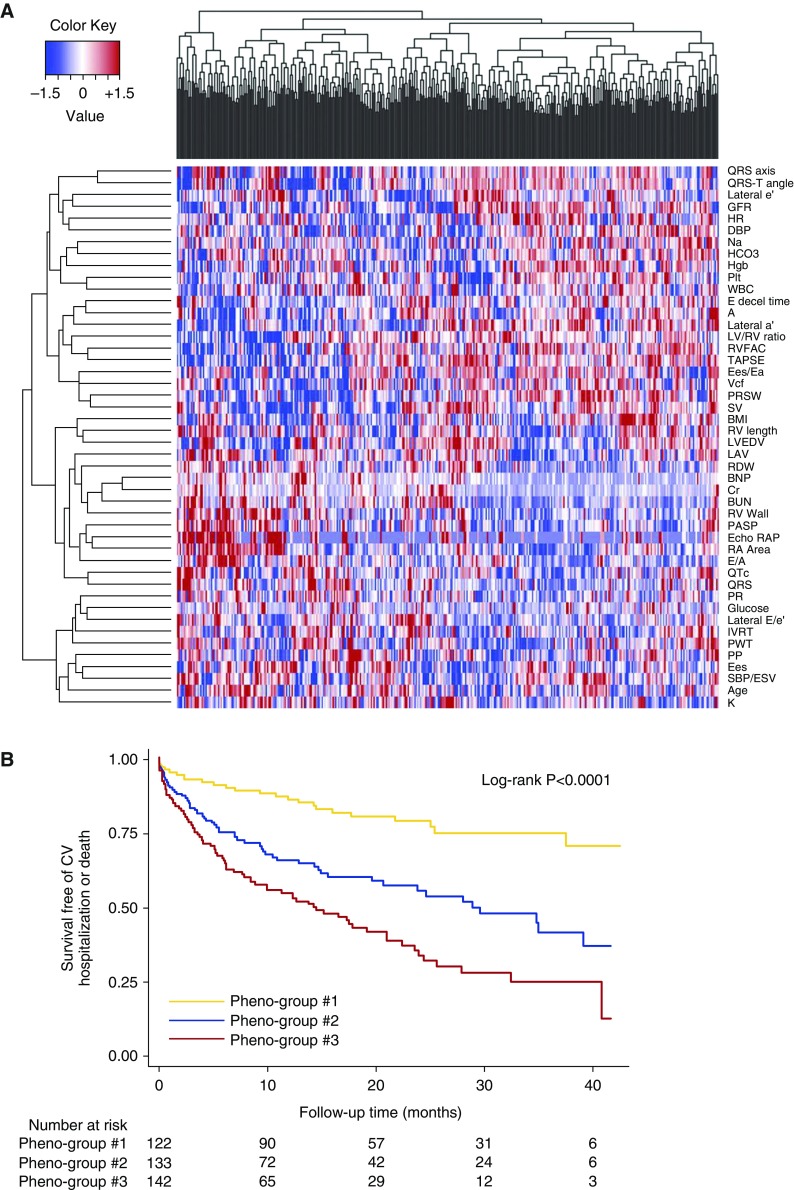
Figure 3.
Phenomapping for novel classification of heart failure with preserved ejection fraction. (A) Phenotype heat map (phenomap) of heart failure with preserved ejection fraction. Columns represent individual study participants; rows represent individual phenotypes. Red indicates increased value of a phenotype; blue indicates decreased value of a phenotype. (B) Survival free of cardiovascular (CV) hospitalization or death stratified by phenogroup. Reprinted by permission from Reference 31.

