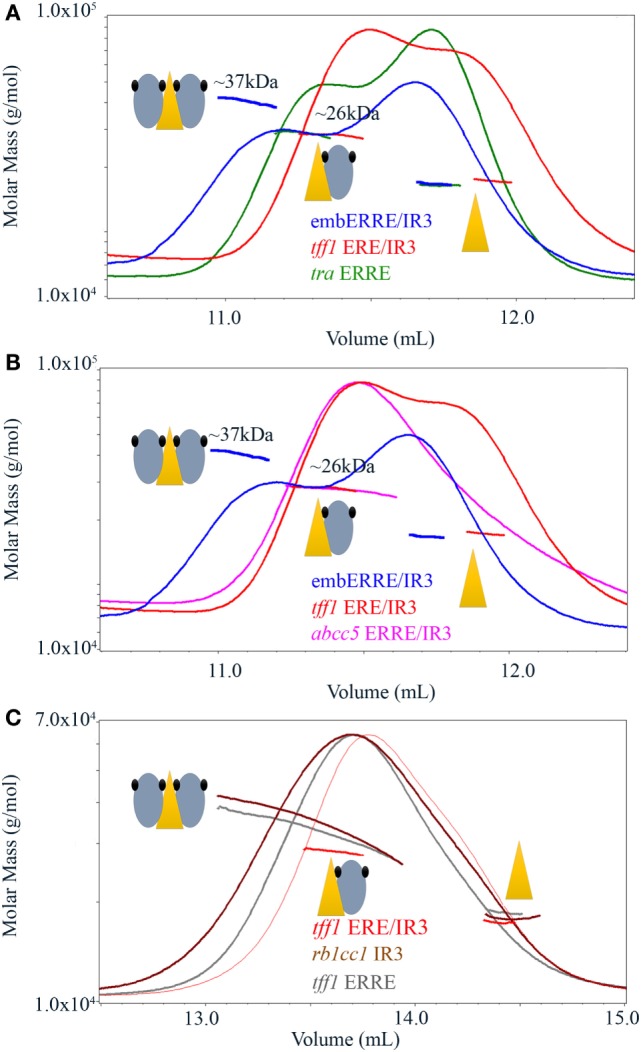
Figure 3.

Size-exclusion chromatography-coupled multi-angle laser light scattering of ERRα DNA-binding domain (DBD)–DNA complexes. (A) Size-exclusion chromatography (SEC)-MALLS analysis of ERRα DBD bound to embERRE/IR3(26), tff1 ERE/IR3(26), and tra estrogen-related response element (ERRE) (26) (160 µM) showing the elution profile on a SEC S75 10/300 with the direct molar mass measurement of each elution peak. ERRα DBD elutes as a dimer for embERRE/IR3(26) with a measured molar mass of around 37 kDa and as a monomer for tra ERRE(26) and tff1 ERE/IR3(26) with a measured molar mass of 26 kDa. An excess of the 26 bp DNA fragment is seen at the right-hand side of the elution profile. (B) SEC-MALLS analysis of ERRα DBD bound to embERRE/IR3(26), tff1 ERE/IR3(26), and abcc5 ERRE/IR3(26) (160 µM) showing the elution profile on a SEC S75 10/300 with the direct molar mass measurement of each elution peak. ERRα DBD elutes as a dimer for embERRE/IR3 with a measured molar mass of around 37 kDa, while the embedded abcc5 ERRE/IR3 elutes as a monomer like tff1 ERE/IR3(26) with a measured molar mass of 26 kDa. An excess of the 26 bp DNA fragment is seen at the right-hand side of the elution profile. (C) SEC-MALLS analysis of ERRα DBD bound to tff1 ERE/IR3(26), rb1cc1IR3(26), and tff1 ERRE(26) (100 µM) showing the elution profile on a SEC S200 10/300 with the direct molar mass measurement of each elution peak. In contrast to ERRα DBD-tff1 ERE/IR3(26) that elutes as a monomer with a measured molar mass of 26 kDa, ERRα DBD bound to rb1cc1 IR3(26) and tff1 ERRE(26) shows a molar mass that varies along the elution profile from the mass of the dimer on DNA (left) to that of the monomer on DNA (toward the center of the peak). An excess of the 26 bp DNA fragment is seen at the right-hand side of the elution profile.
