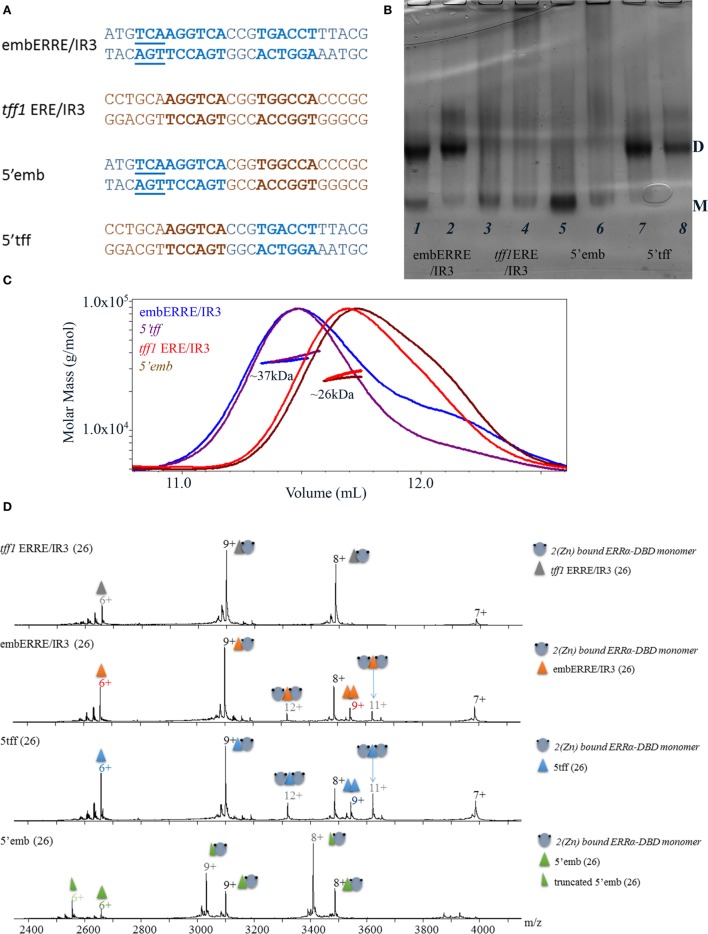
Figure 5.
Biochemical and biophysical analysis of DNA chimeras to delineate structural determinant of dimerization. (A) Nucleotide sequence of the 26 bp DNA fragments, including the sequence of the embERRE/IR3 (blue), tff1 ERE/IR3 (brown), 5′emb (5′-end of embERRE/IR3 and spacer and 3′-end of tff1 ERE/IR3), and 5′tff (5′-end of tff1 ERE/IR3 and spacer and 3′-end of embERRE/IR3). (B) Ammonia/CAPS polyacrylamide gel of the complexes for two different ratios of DNA:protein (1:1 and 0.25:1) for embERRE/IR3 (lanes 1, 2), tff1 ERE/IR3 (lanes 3, 4), 5′emb (lanes 5, 6), and 5′tff (lanes 7, 8). (C) Size-exclusion chromatography (SEC)-MALLS analysis of ERRα DNA-binding domain (DBD) bound to embERRE/IR3 (blue), tff1 ERE/IR3 (red), 5′tff (magenta), and 5′emb(brown) (160 µM) showing the elution profile on a SEC S75 10/300 with the direct molar mass measurement of each elution peak. ERRα DBD elutes as a dimer for embERRE/IR3 and 5′tff with a measured molar mass of around 37 kDa and as a monomer for tff1 ERE/IR3 and 5′emb with a measured molar mass of 26 kDa. (D) Non-denaturing mass spectrometry analysis of ERRα DBD-DNA complexes for (from top to bottom) tff1 ERE/IR3, embERRE/IR3, 5′tff, and 5′emb, all being 26-bp long. The different charged states of the monomeric and dimeric ERRα DBD–DNA complexes are given in black and gray, respectively, above the m/z peak. In all spectra, a small fraction of free DNA and free DNA dimer is observed (at m/z of around 2,900).

