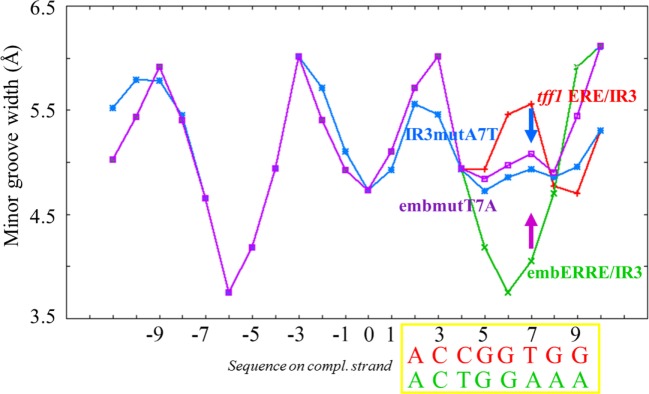
Figure 7.
DNA shape predictions of embERRE and tff1 ERE/IR3 and their respective point DNA mutant embmutT7A and IR3mutA7T. Minor groove width (Å) is plotted as a function of base sequence for embERRE/IR3 (green), tff1 ERE/IR3 (red), embmutT7A (purple), and IR3mutA7T (blue). The position of the bases is given with respect to the central base pair of the spacer (position 0). The sequences of the complementary strand of tff1 ERE/IR3 (red) and embERRE/IR3 (green) are given for positions (+2) to (+9) and comprise the second half-site and the two first flanking nucleotides. The purple arrow indicates the destabilization in the dimer formation seen for ERRα DNA-binding domain-embERRE when position (+7) is affected (embmutT7A), while the blue arrow indicates a partial stabilization of dimer formation when tff1 ERE/IR3 is point-mutated by introducing an T/A at position (+7), resulting to IR3mutA7T.

