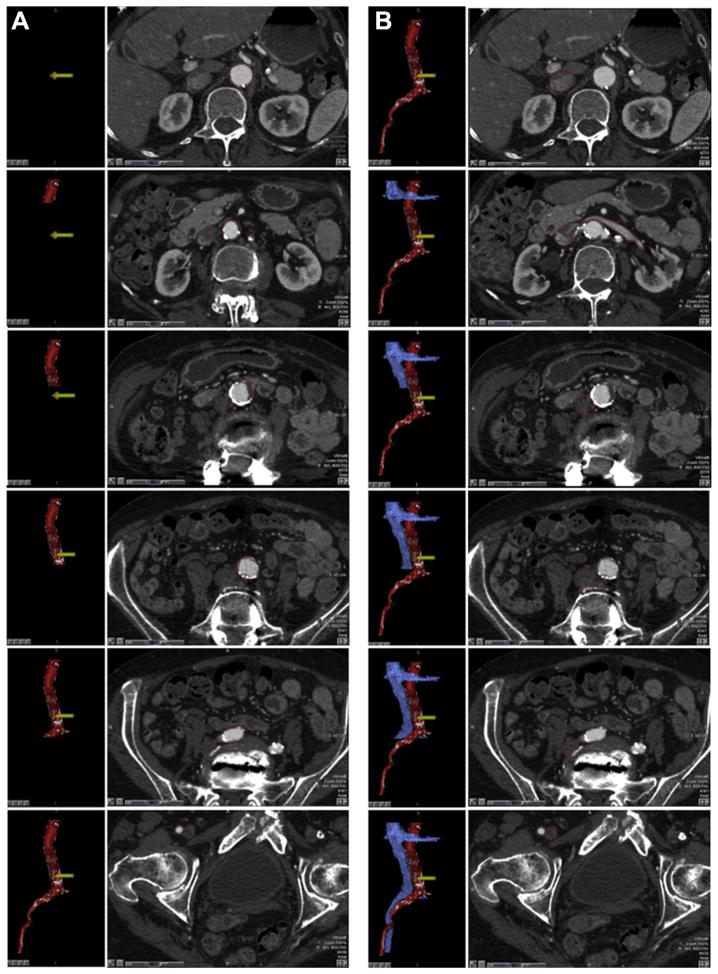
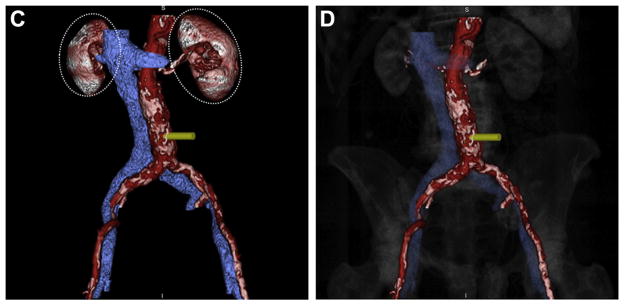
FIGURE 4. Segmentation and Visualization of the Aorta and Cava.
Regions of interest depicting the (A) aorta and (B) vena cava are drawn manually or automatically using image reconstruction workstations. As these structures are defined, an accompanying surfaced-rendered 3-dimensional image is generated (red-colored aorta with white calcium, blue vena cava). (C) Distracting contrast-enhanced structures such as the kidneys (dashed ovals) can be removed from the 3-dimensional surface rendering. (D) Highly transparent (90%) depiction of the bony structures provides anatomic landmarks for the operator.


