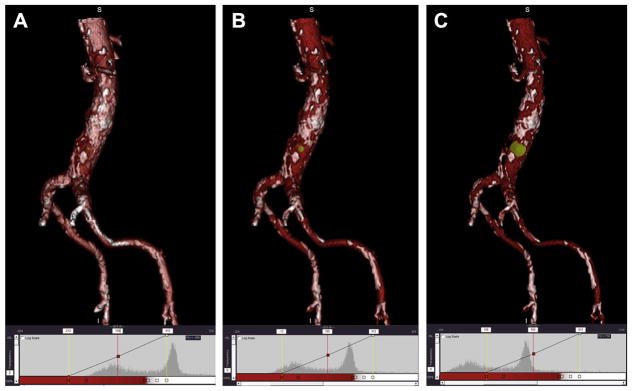
FIGURE 5. Proper Adjustment of 3-Dimensional Surface Rendering Display Level to Visualize Aortic Calcification as Seen From the Cava at Proposed Target.
(A) Setting an image level inappropriately low at 100 confuses exaggerates the extent of calcification. The image intensity histogram depicts that a majority of the pixels are above the 200 level (red line). (B) Appropriate image level of 300 discriminates vascular contrast (red) from aortic calcification (white) on the 3-dimensional surface rendering and on the histogram by evenly dividing the 2 populations of pixels. (C) An excessive image level of 500 results in artificially suppressing the appearance of calcium and will misleadingly depict a larger calcium-free target window. The corresponding histogram shows that most of the pixels are below the threshold level of 500 (red line). The proposed target appears as a yellow arrowhead or dot.

