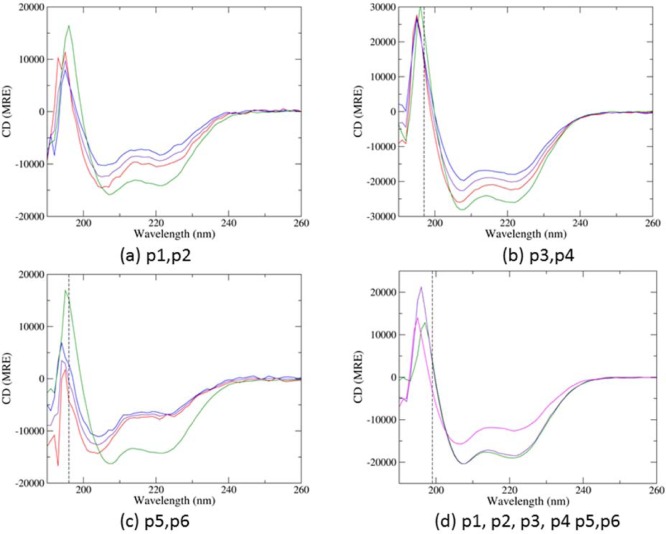
Figure 2.
CD spectra of the three mixtures of the designed pairs of peptides: (a) p1 and p2, (b) p3 and p4, and (c) p5 and p6 (shown in green). Each panel also shows the individual peptide spectra (red and blue, in numerical order), and the theoretical signal for a mixture of the two without interaction (a combination of the two single peptide signals, shown in purple). (d) CD spectrum of all six hub peptides mixed together (green), compared with the theoretical spectrum predicted from the individual spectra (shown in magenta), and from the designed pair spectra (shown in purple). Each sample had a concentration of 20 μM per peptide, in PBS buffer (pH 7.4), measured at 20 °C. Dotted lines represent the wavelength cutoff below which data cannot be reliably obtained, as dictated by the CD instrument.

