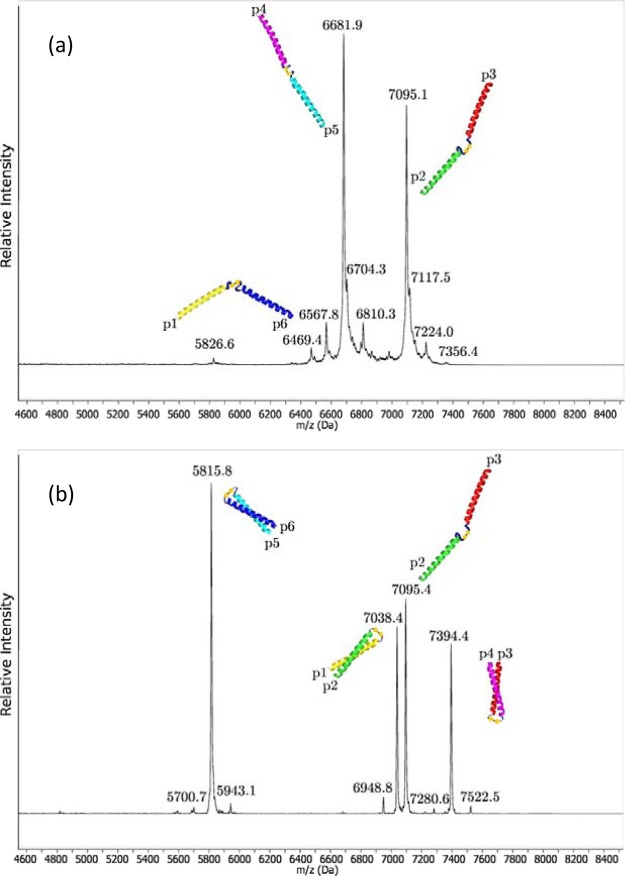
Figure 4.
MALDI spectra of glutathione experiments. The initial spectrum has prominent peaks due to the p4–p5 (MW 6682 Da) and p3–p2 (MW 7095 Da) species, and smaller peaks due to deletions and the p6–p1 peptide (MW 6470 Da). After rearrangement, the p4–p5 and p6–p1 species are no longer seen, while the p6–p5 (MW 5814 Da), p1–p2 (MW 7039 Da) and p3–p4 (MW 7395 Da) species have appeared. All of the trace peaks correlate with impurities in the initial samples and do not correlate with possible rearrangements.

