. 2016 Feb 12;7(4):2524–2531. doi: 10.1039/c5sc04246a

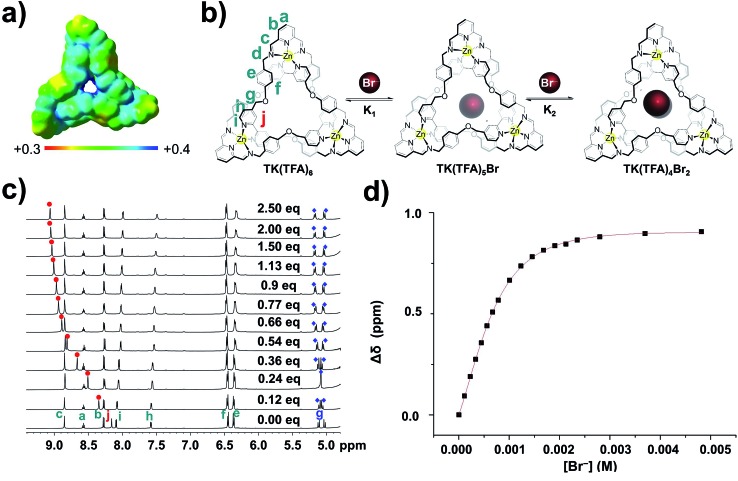
Fig. 3. Measurement of the bromide ion binding constants of TK6+ complexes by titration. (a) Computed B3LYP/6-31G(d) electrostatic potential of TK6+ on the molecular surface defined by the 0.001 electrons bohr–3 contour of the electron density (b) schematic representation of bromide ion binding. (c) Stacked plots of 1H NMR (600 MHz, 298 K) spectra of 1.87 mM solutions of TK6+ in D2O titrated with, bottom to top, increasing amounts of tetrabutylammonium bromide. (d) Binding isotherm obtained by plotting Hj signal shift versus bromide ion concentration. In most cases, addition of more than two equivalents of anion precipitated the knot and prevented further measurements.

Fig. 3