Table 1. Purity and mass conformation of representative compounds.
| R1 | R2 | R3 | R4 | Purity a (%) | MS[M + H]+ |
||
| Calcd | Found | ||||||
| 7 |

|

|

|

|
91 | 574.25 | 574.22 |
| 8 |

|
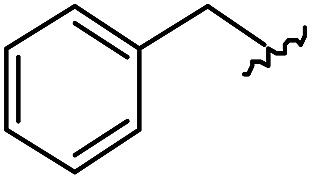
|

|

|
96 | 492.29 | 492.04 |
| 9 |

|
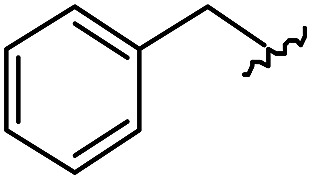
|

|
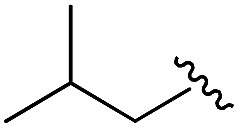
|
99 | 530.27 | 530.03 |
| 10 |

|

|
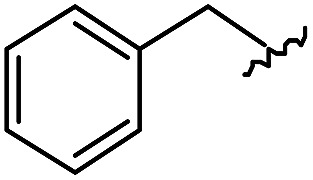
|

|
93 | 524.26 | 524.15 |
| 11 |

|

|

|
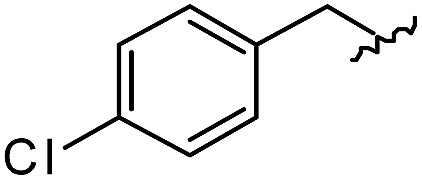
|
98 | 558.22 | 558.20 |
| 12 |

|

|

|

|
90 | 753.31 | 753.67 |
| 13 |

|

|

|
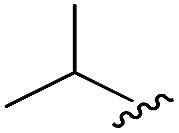
|
90 | 512.26 | 512.32 |
| 14 |

|
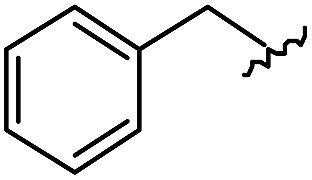
|
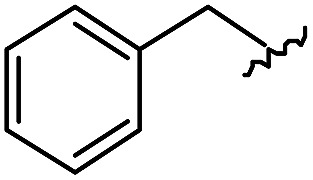
|
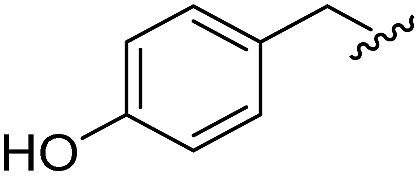
|
95 | 514.24 | 514.06 |
aPurities in percentage were obtained using PDA (photodiode array)-based LC/MS analysis of crude final compounds after a short filter column. Pbf = 2,2,4,6,7-pentamethyldihydrobenzofuran.
