Fig. 2.

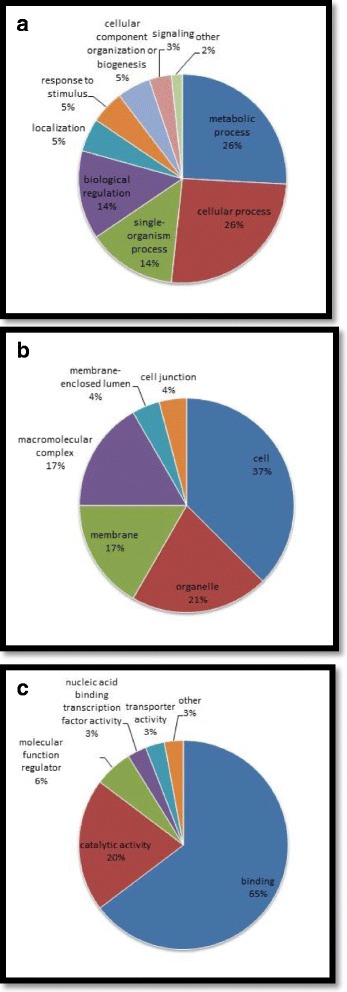
Pie chart of the distribution of phosphorylated proteins from gene ontology functional classification in terms of a biological processes, b cellular components, and c molecular functions

Pie chart of the distribution of phosphorylated proteins from gene ontology functional classification in terms of a biological processes, b cellular components, and c molecular functions