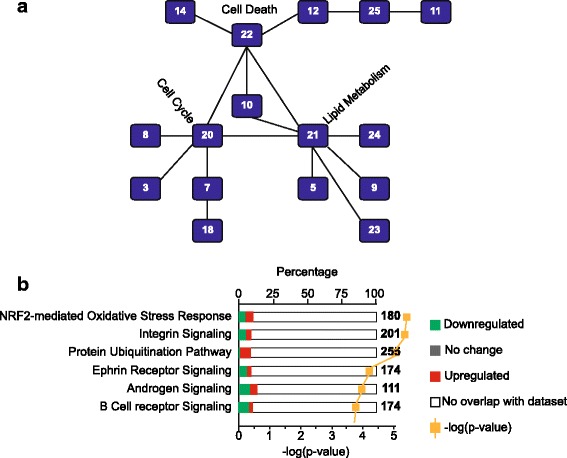
Fig. 2.

Ingenuity Pathway Analysis (IPA) of ESCC. a Interconnected canonical pathways. Pathway 20 (injury and abnormalities and cell cycle), pathway 21 (carbohydrate and lipid metabolism, and molecular transport), and pathway 22 (cell death and survival pathways) serve as hub for interconnected canonical pathways. b The enriched canonical pathways in ESCC by IPA. The most enriched pathways represented the higher –log(p-value). The white bar represents the genes that do not overlap with the data set. Green bar represents genes that are down-regulated and red bar represents genes that are up-regulated. The gray bar demonstrates the genes without any change in expression.
