Fig. 4.

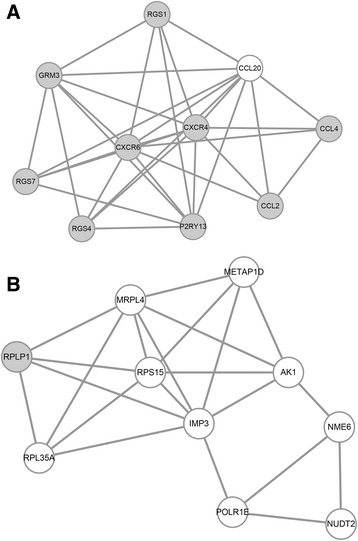
Modules identified in the PPI network of DEGs. a Module 1 and b module 2. Gray nodes represent upregulated genes, and white nodes represent downregulated genes

Modules identified in the PPI network of DEGs. a Module 1 and b module 2. Gray nodes represent upregulated genes, and white nodes represent downregulated genes