Fig. 1.

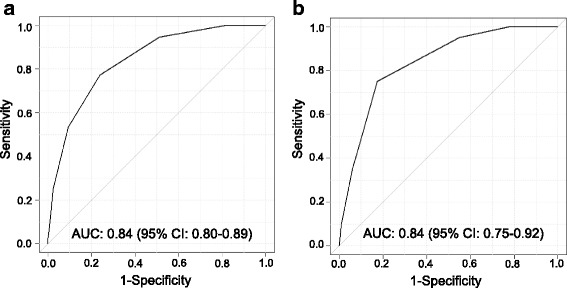
Receiver operating characteristic curves for the prognostic scoring model predicting all-cause mortality for (a) cohort 1 and (b) cohort 2. AUC, area under the curve; 95% CI, 95% confidence interval

Receiver operating characteristic curves for the prognostic scoring model predicting all-cause mortality for (a) cohort 1 and (b) cohort 2. AUC, area under the curve; 95% CI, 95% confidence interval