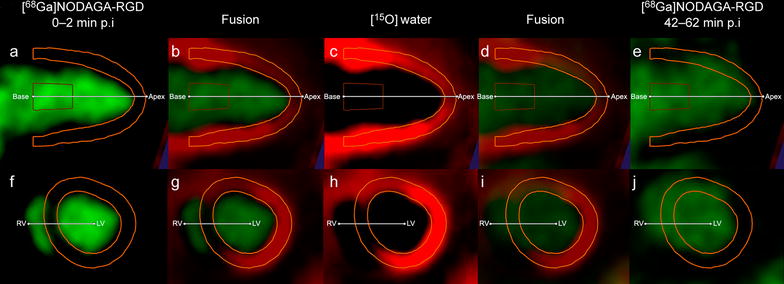
Fig. 1.

Co-registration of [68Ga]NODAGA-RGD and [15O]water PET images and definition of myocardial contours. a and f demonstrate [68Ga]NODAGA-RGD images during the first 2 min after injection of the tracer, b and g demonstrate the fusion of [15O]water PET images (c, h) and [68Ga]NODAGA-RGD images used in the co-registration (a, f). Yellow lines represent myocardial contours defined in [15O]water PET images and copied to the [68Ga]NODAGA-RGD images. d and i demonstrate the fusion of the [15O]water PET images (c, h) and [68Ga]NODAGA-RGD images during the last 20 min of the imaging session (e, j) that demonstrate higher activity in the ischemic area in the anteroseptal wall as compared with the remote myocardium in the inferoposterior wall
