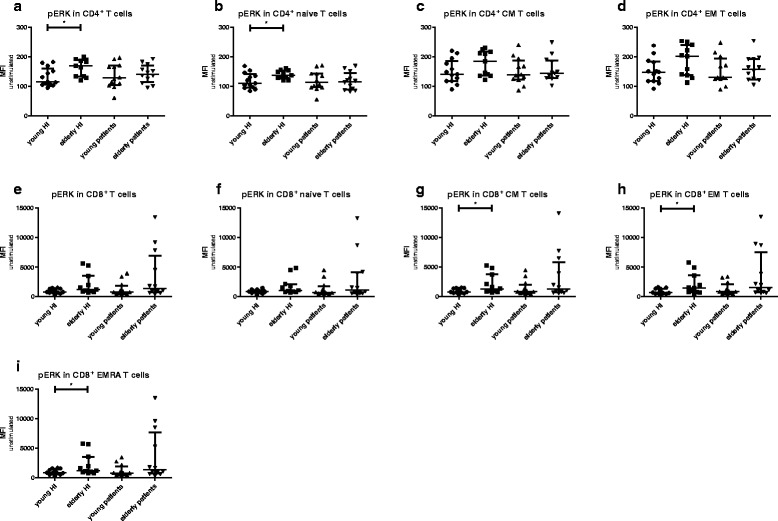
Fig. 6.

Auto-phosphorylation (baseline) of ERK in T cells subsets from healthy individuals (HI) and end stage renal disease (ESRD) patients. Phosphorylation of ERK in (a) CD4+, (b) CD4+ naive, (c) CD4+ central memory (CM), (d) CD4+ effector memory (EM), as well as (e) CD8+, (f) CD8+ naive, (g) CD8+ CM, (h) CD8+EM, (i) CD8+ highly differentiated effector T cells (EMRA). Dots and squares represent young (n = 13) and elderly HI (n = 11), and upward- and downward-facing triangles correspond to young (n = 12) and elderly patients (n = 12), respectively. P value: *< 0.05; Data are given as median with interquartile range
