
Fig. 7.
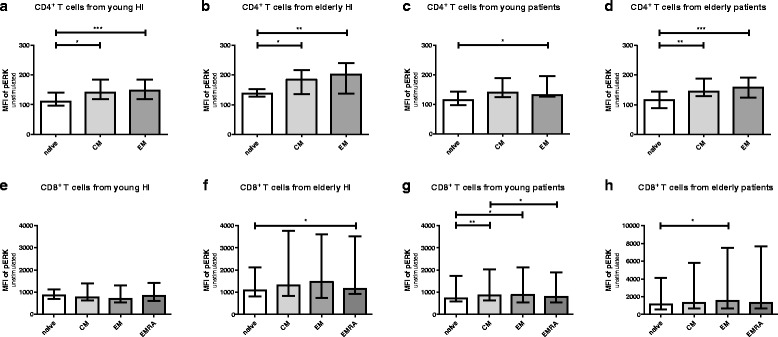
Auto-phosphorylation (baseline) of ERK according to T cell differentiation status in healthy individuals (HI) and end stage renal disease (ESRD) patients. Phosphorylation of ERK in CD4+ T cells from (a) young HI (n = 13), (b) elderly HI (n = 11), (c) young patients (n = 12), and (d) elderly patients (n = 12), as well as CD8+ T cells from (e) young HI, (f) elderly HI, (g) young patients, and (h) elderly patients. Blank bars and bars with light grey to dark grey represent naive, central memory (CM), effector memory (EM) and highly differentiated effector T cells (EMRA) T cells, respectively. P value: *< 0.05; **< 0.01; ***< 0.001; Data are given as median with interquartile range