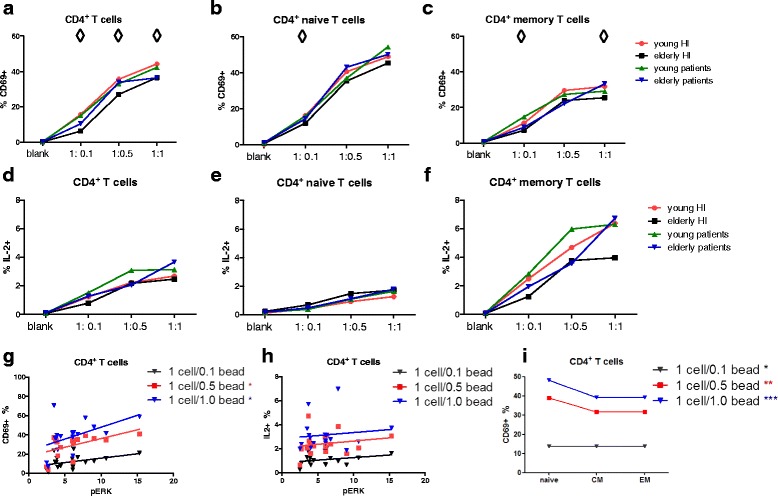
Fig. 8.

Percentages of CD69-expressing and IL-2 producing CD4+ T cell subsets in healthy individuals (HI) and end-stage renal disease (ESRD) patients. Percentages of CD69+ CD4+T cells were shown from healthy individuals (HI) (young n = 4, elderly n = 5) and end-stage renal disease (ESRD) patients (young n = 4, elderly n = 5) for (a) total, (b) naive, (c) memory CD4+ T cells, and frequencies of IL-2 expression were given for (d) total, (e) naive, (f) memory CD4+ T cells. Red dots and orange squares represent young and elderly HI, and blue upward- and purple downward-facing triangles correspond to young and elderly patients, respectively. The association between (g) percentages of CD69+ or (h) IL-2+ CD4+ T cells and ERK phosphorylation (depicted as fold increase by dividing the MFI of stimulated cells by that of unstimulated cells) is depicted. (i) The differentiation-associated relation between percentages of CD69+ and different CD4+ T cell subsets (naive, CM, EM) is shown. Black and blue downward-facing triangles represent 1 cell/0.1 bead and 1 cell/1 bead stimulation, and red squares correspond to 1cell/0.5 bead stimulation. ◊ represents a significant difference in the percentage of CD69+ T cells calculated for each specific CD4+ T cell subset when comparing young with elderly HI, or when comparing young with elderly patients. *represents a significant difference in the percentage of CD69+ T cells comparing CD4+ subsets or CD8+ subsets within each study group. P value: ◊ <0.05;*< 0.05; **< 0.01; ***< 0.001. Data are given as medians
