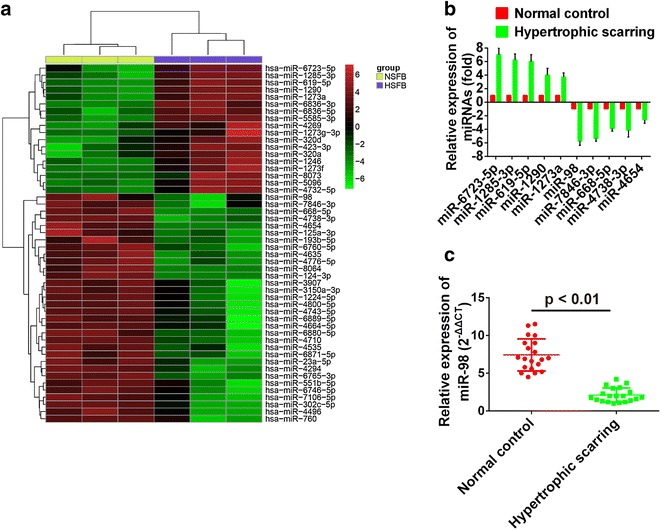
Fig. 1.

a Heatmap of a total of 50 miRNAs that were significantly down-regulated or up-regulated. For each miRNA the red color means an up-regulated expression of, and the green color means a down-regulated expression. b qRT-PCR was used to validate the results of microarray chips. c The relative expression of miR-98 in normal control and hypertrophic scarring tissues
