Figure 1.
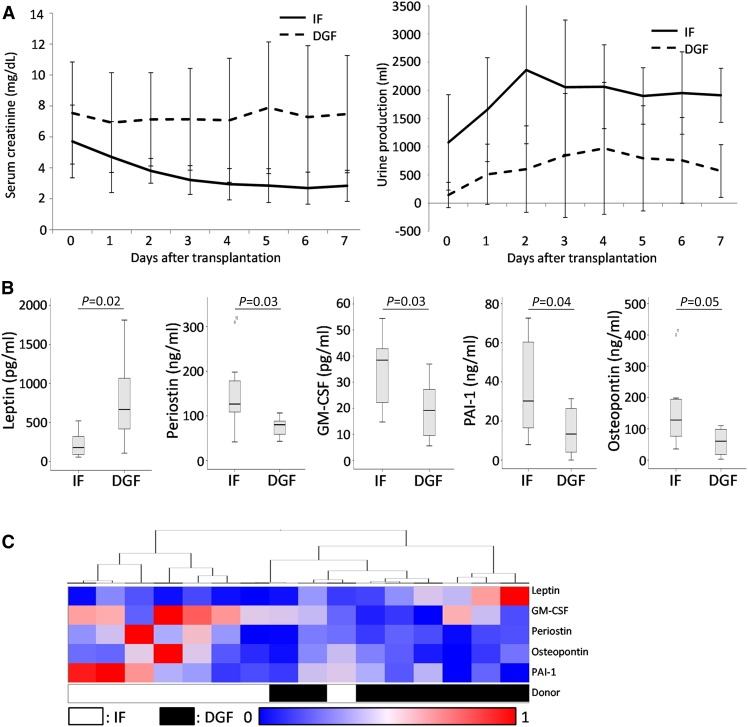
Analysis of secreted proteins in the discovery panel. (A) Serum creatinine (left) and urine production (right) evolution of the immediate function (IF) and delayed graft function (DGF) discovery sets presented as average±SD. (B) Boxplots representing levels of proteins significantly different between IF and DGF groups in the discovery panel. (C) Heatmap representing clustering of samples from IF and DGF donor kidneys.

