Figure 2.
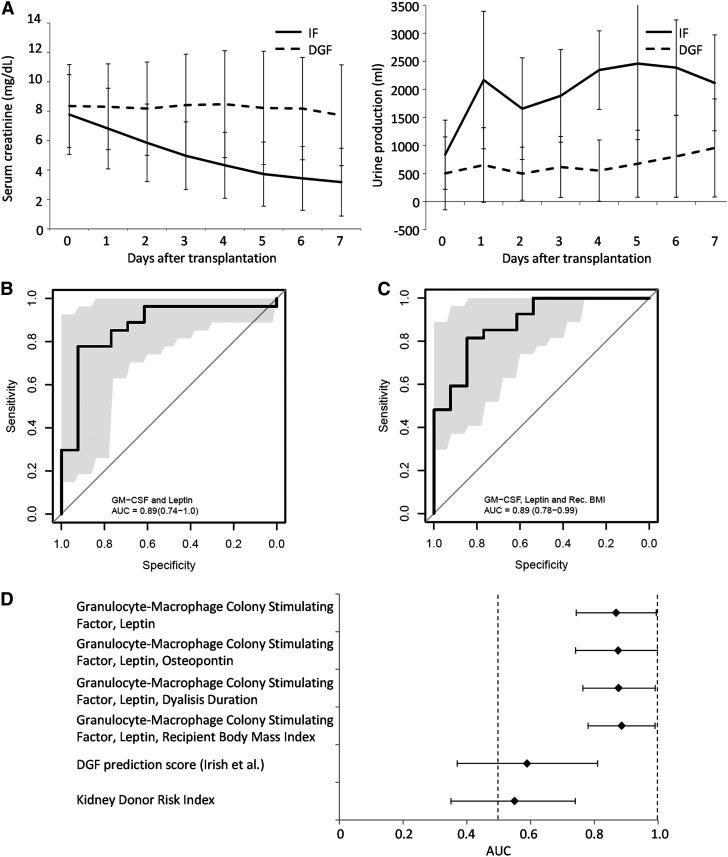
Receiver operating characteristic curves of prediction models. (A) Serum creatinine (left) and urine production (right) evolution of immediate function (IF) and delayed graft function (DGF) verification sets presented as average±SD. Receiver operating characteristic curves representing prediction models on the basis of (B) GM-CSF and leptin, and (C) GM-CSF, leptin, and recipient body mass index, with 95% confidence intervals as determined by bootstrap analysis in gray. (D) Area under the curve (AUC) and 95% confidence intervals of prediction models on the basis of various combinations of factors (indicated); shaded areas indicate bootstrap 95% confidence intervals at all given sensitivity/specificity thresholds.

