
FIGURE 1.
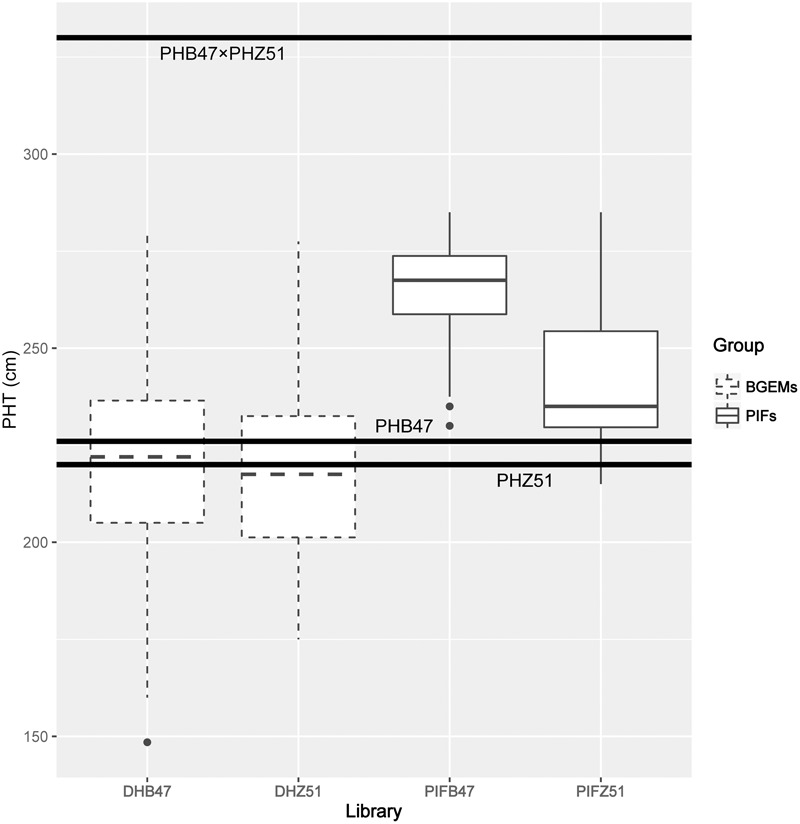
Box plots of PHT performance of the BGEM lines and PIFs. The box in the middle between the first (Q1) and third quartile (Q3) represents 50% values. The lines within in each box indicate the median value for each group. The three bold horizontal lines represent the F1 hybrid of PHB47 × PHZ51, PHB47, and PHZ51, respectively.