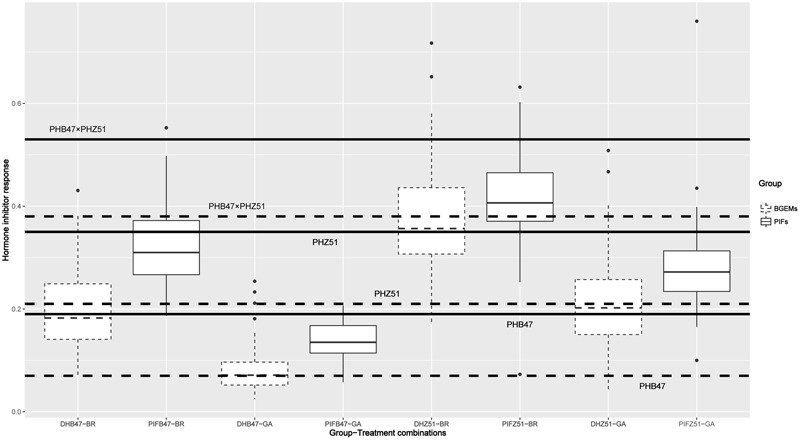
FIGURE 3.

Hormone inhibitor responses of BGEM lines and PIFs. X-axis: groups from left to right represent different combinations of library and hormone inhibitor treatments. For example, DHB47-BR represents the DHB47 library treated with BR inhibitor. Y-axis reflects the hormone inhibitor response which is calculated as (mesocotyl length with hormone inhibitor treatment)/(mesocotyl length with water treatment). The box in the middle between the first (Q1) and third quartile (Q3) represents 50% values. The lines within in each box indicate the median value for each group. Solid and dashed lines indicate BR and GA treatment, respectively. The six horizontal lines from top to bottom indicate F1 (hybrid of PHB47 × PHZ51) BR inhibitor response, F1 GA inhibitor response, PHZ51 BR inhibitor response, PHZ51 GA inhibitor response, PHB47 BR inhibitor response, PHB47 GA inhibitor response, respectively.
