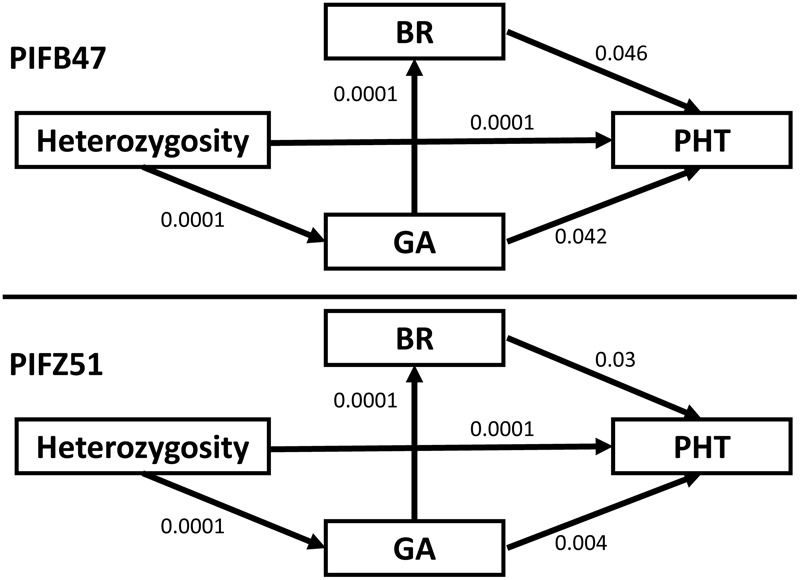
FIGURE 5.

The final best model from path analysis for PIFB47 and PIFZ51. Heterozygosity represents for the proportion of heterozygous markers for PIFs. BR and GA represents for brassinosteroid and gibberellin inhibitor response, respectively. PHT represents for plant height. The numbers represent for P-values of direct relationships between each two variables (without confounding effects).
