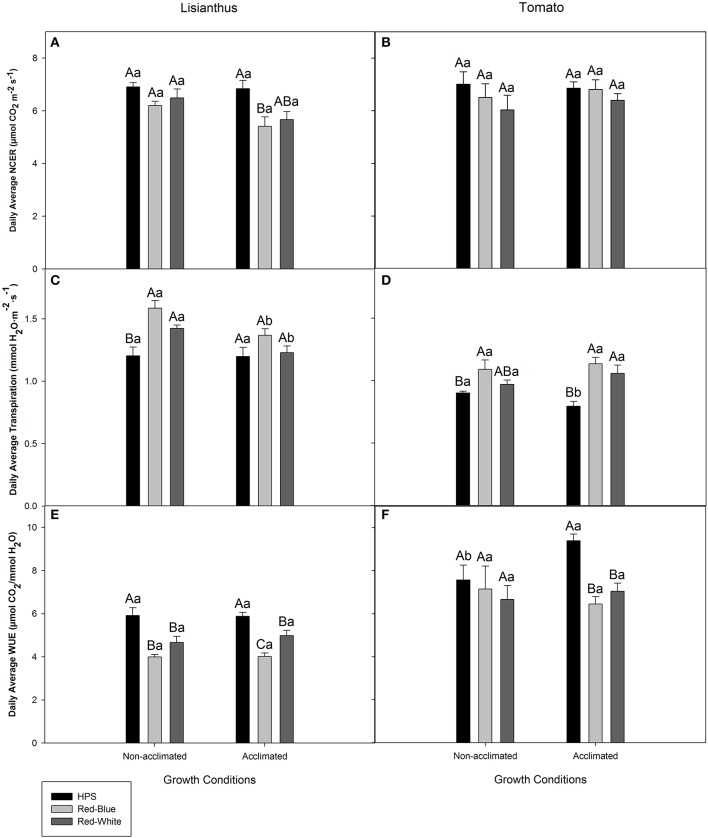
Figure 4.
Day-time whole plant average NCER (A,B), transpiration rate (C,D), and WUE (E,F) of lisianthus (A,C,E) and tomatoes (B,D,F) grown in a greenhouse under non-acclimated and acclimated growth conditions. Average lisianthus whole plant data are daily means ± the standard error of 12 replicates for plants grown under acclimated conditions and 6 replicates for lisianthus grown under non-acclimated conditions. Tomato whole plant data are daily means ± the standard error of 9 replicates for both acclimated and non-acclimated growth conditions. Upper case (A–C) represent statistical differences within a panel comparing non-acclimated or acclimated plants within a growth condition, across light treatments. Lower case (a,b) represent statistical differences within a panel between non-acclimated and acclimated plants analyzed under the same light treatment. All statistical comparisons were done using a one-way ANOVA and a Tukey-Kramer adjustment (p < 0.05).

