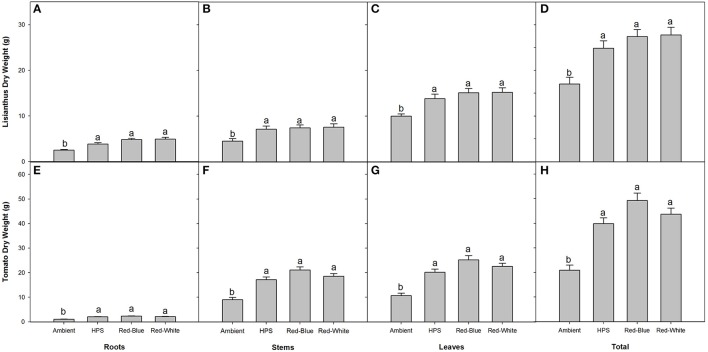
Figure 5.
Biomass partitioning of lisianthus (A–D) and tomatoes (E–H) for plants grown under either ambient, HPS, RB LED, or RW LED light treatments. Lisianthus bars represent the mean of 12 plants for supplemental light grown plants and 18 plants for ambient grown plants ± standard error. Tomato bars represent the mean of 6 replicates ± the standard error for both plants grown under supplemental lighting and ambient lighting. Letters (a,b) represent significant differences within panels as determined by a one-way ANOVA with a Tukey-Kramer adjustment (p < 0.05).

