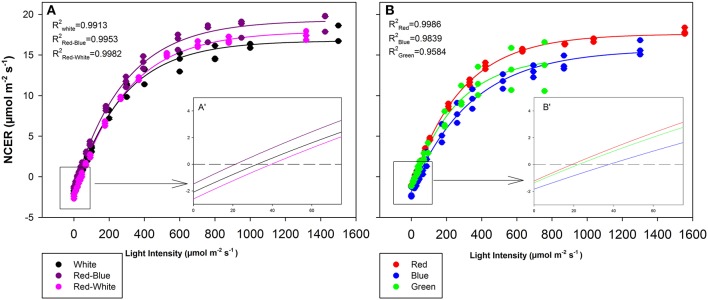
Figure 6.
Leaf NCER for mixtures (A) and monochromatic (B) LEDs of tomato plants which were grown in growth chambers under fluorescent light. Insert A′ and B′ are magnifications of the 0–75 μmol m−2 s−1 PAR region of panels (A,B), respectively for better interpretation by the reader. Leaf NCER values of 3 replicate leaves shown with a regression lines fit to f = yo + a(1−e(−b*x)) for each light treatment.

