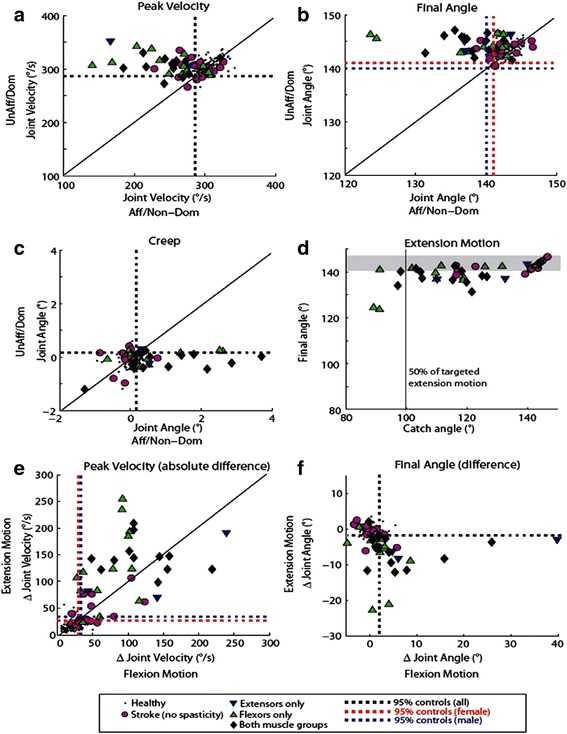
Fig. 3.

a-c Peak velocity, final angle and creep parameters compared across limbs for all participants for extension movement (testing flexors). Dotted lines represent cutoff values calculated from control behavior. Participants with stroke were considered impaired if they fell below the 5th percentile cutoff for peak velocity and final angle, and if they fell above the 95th percentile for creep. d Catch angle calculated for the extension movement compared to extension final angle (affected arm). Gray line represents the 50% of the targeted extension movement, gray shaded area represents the range of final angles for control participants. e-f Peak velocity and final angle difference (affected/non-dominant - unaffected/dominant) compared between flexion motion (testing extensors) and extension motion (testing flexors)
