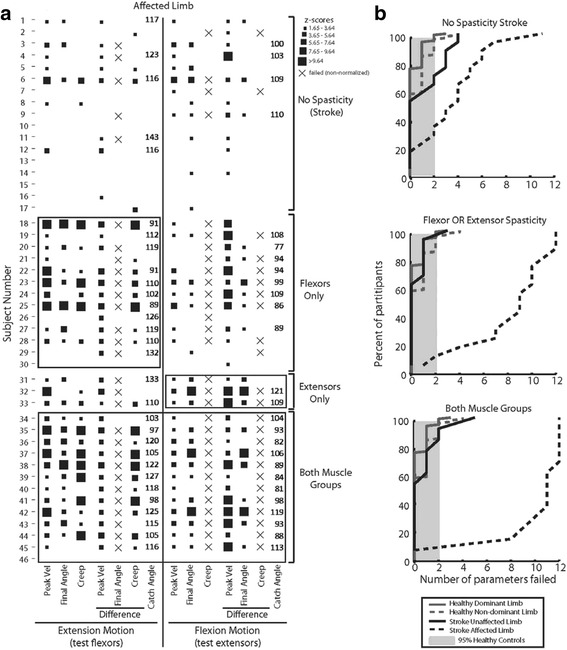
Fig. 4.

a Individual participant performance on each task parameter. The presence of a square indicates that the participant failed that parameter (behavior fell outside 95% of control performance). Square size indicates the z-score range, with small squares representing lower z-score values and larger squares representing higher z-score values (and worse normalized performance on the parameter). For those participants where it was detected, catch angle is reported. b Cumulative sum of the number of parameters failed for each participant group. Dark gray traces represent number of parameters failed by control participants, black traces represent number of parameters failed by stroke participants (affected/non-dominant arm, dotted line; unaffected/dominant arm, solid line). Light gray shaded area represents 95th percentile for controls. Middle plot combines Flexors only and Extensors only participant groups. Note that almost all participants identified with spasticity in both muscle groups (bottom plot) failed more parameters than 95% of all control participants
