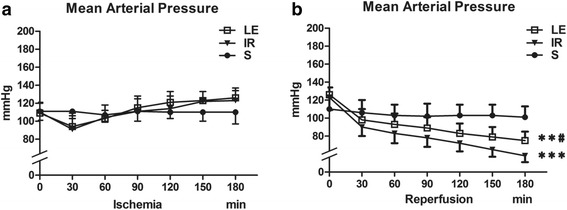
Fig. 1.

Mean arterial pressure (n = 8 in Each Group). a The MAPs showed no difference among three groups throughout the ischemia period. b The MAPs during the reperfusion period. Three groups displayed differences (P < 0.001). MAP in three groups were presented graphically. Data were given as mean ± SD. ** p < 0.01 (vs. S), *** p < 0.001 (vs. S). # p < 0.05 (vs. IR)
