
Fig. 1.
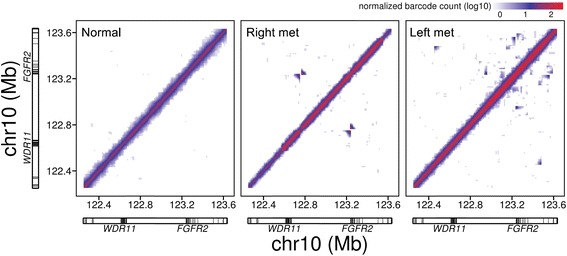
Barcode overlap plots of the genomic region surrounding the proto-oncogene FGFR2. The level of barcode sharing between 10-kb windows in a 1.4-Mb genomic region including FGFR2 was determined for the normal sample and the right and left metastatic samples. The highest level of overlap (red) is expected along the diagonal, while off-diagonal signals (red or blue) indicate the presence of structural variants