
Fig. 3.
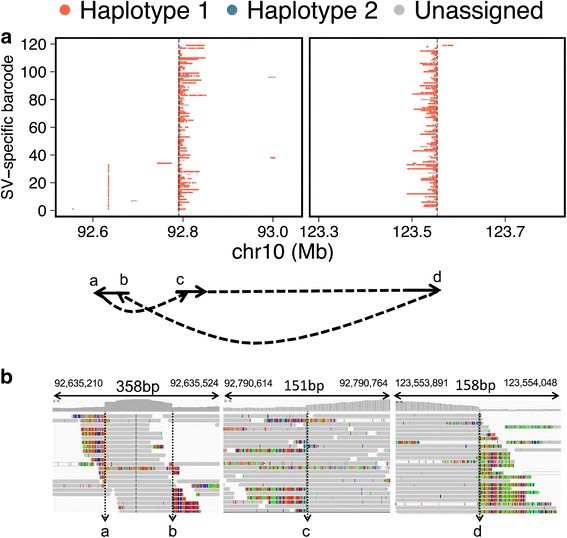
Complex breakpoint resolution using molecular barcode mapping. a The SV-specific molecules for breakpoint 1 and breakpoint 2 of the duplication SV in the right metastasis are plotted according to the mapping location of molecular barcoded reads. Each row of the plot represents one SV-specific molecule, depicting how each SV-specific molecule spans the SV breakpoint. Molecular breakpoints are denoted with a, b, c, and d, and the arrow structure indicates breakpoint connection and directionality. b IGV plots of the molecular breakpoints display soft-clip evidence of the breakpoints