Fig. 1.

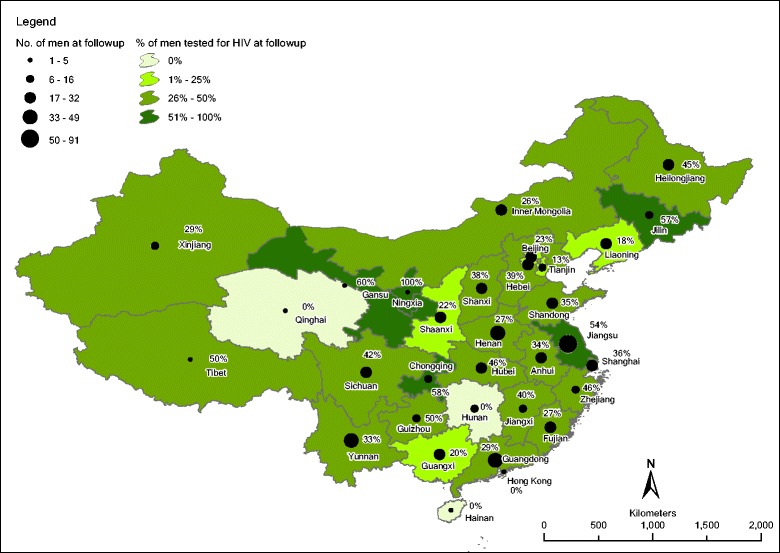
Spatial distribution of number of men at follow-up (n = 624) denoted by circle size and proportion of HIV testing at follow-up denoted by province area in graduated color (classified by natural break)

Spatial distribution of number of men at follow-up (n = 624) denoted by circle size and proportion of HIV testing at follow-up denoted by province area in graduated color (classified by natural break)